

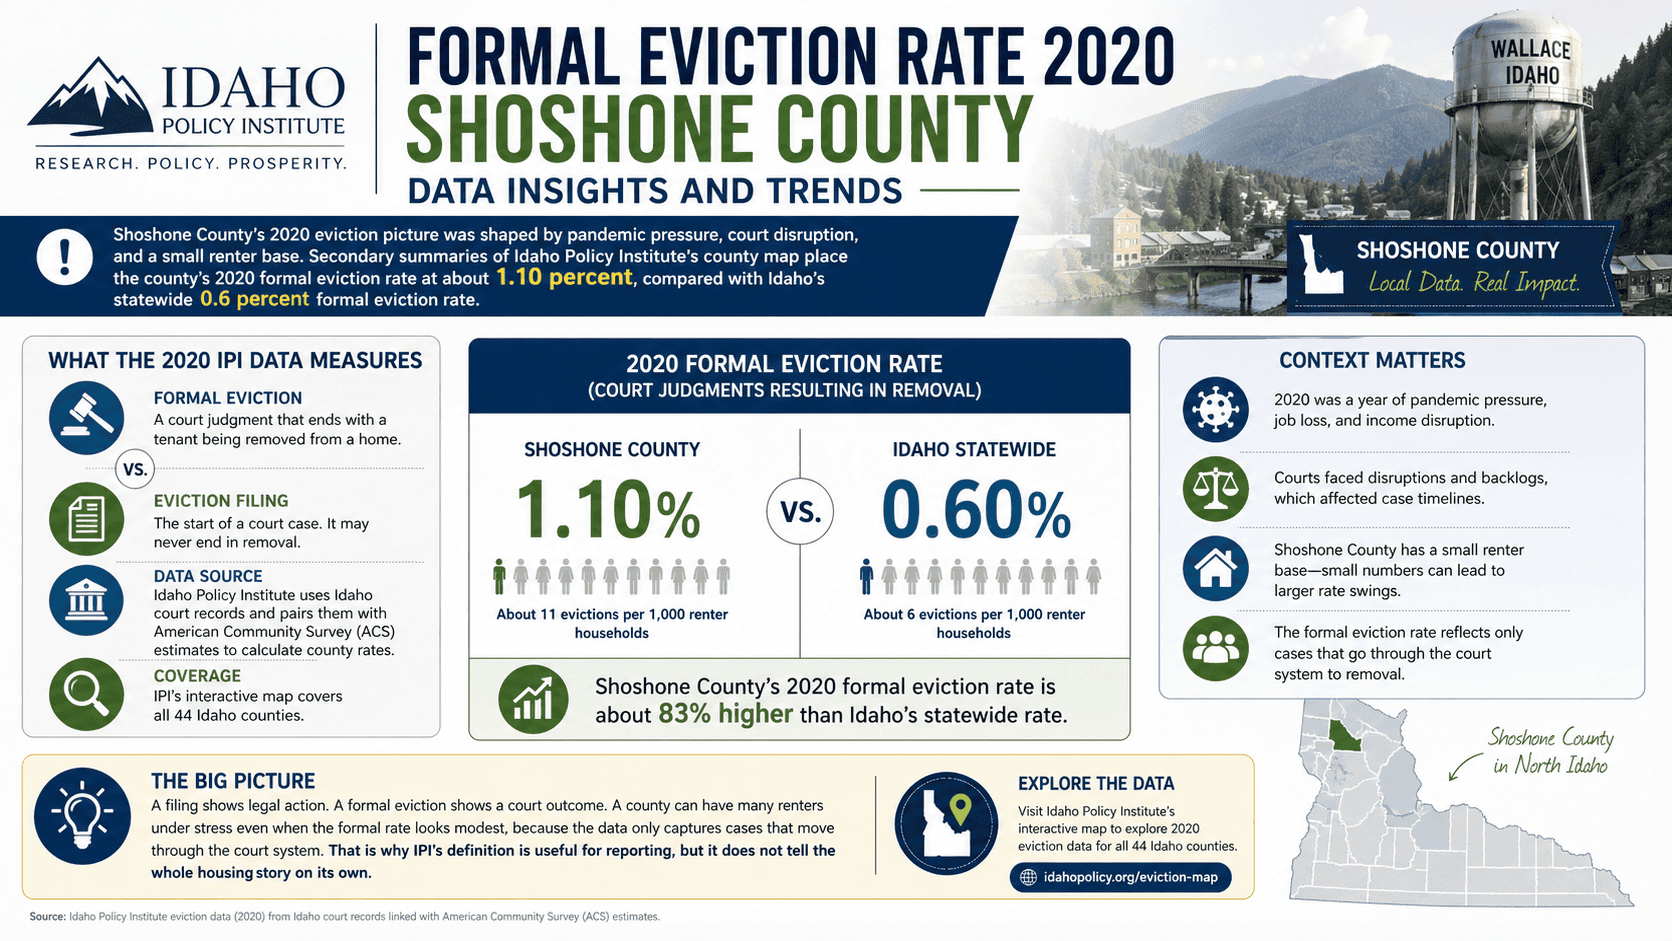

Shoshone County’s 2020 eviction picture was shaped by pandemic pressure, court disruption, and a small renter base. Secondary summaries of Idaho Policy Institute’s county map place the county’s 2020 formal eviction rate at about 1.10 percent, compared with Idaho’s statewide 0.6 percent formal eviction rate.
What the 2020 IPI data measures
Idaho Policy Institute defines a formal eviction as a court judgment that ends with a tenant being removed from a home. That is different from an eviction filing, which is only the start of the court case and may never end in removal. IPI says its county level eviction data comes from Idaho court records and is paired with American Community Survey estimates to calculate county rates. The institute also says its interactive map covers all 44 Idaho counties.
That distinction matters. A filing shows legal action. A formal eviction shows a court outcome. A county can have many renters under stress even when the formal rate looks modest, because the data only captures cases that move through the court system. That is why IPI’s definition is useful for reporting, but it does not tell the whole housing story on its own.
Idaho’s statewide 2020 eviction pattern
The statewide 2020 IPI infographic shows that Idaho had 1,893 eviction filings, which was 1 percent of the state’s renting households, and 1,127 formal evictions, which was 0.6 percent of renting households. IPI also reported that Idaho averaged 3.1 evictions per day in 2020.
IPI’s statewide summary also said eviction filings and formal evictions fell by 30 percent from 2019. The lowest monthly filing point came in April 2020, when court closures ordered by the Idaho Supreme Court affected the pace of new cases. The courts reopened in May 2020, and filings and formal evictions rose again after that. IPI linked the monthly changes to court closures, the federal eviction moratorium, unemployment benefits, and emergency rental assistance programs.
That statewide pattern sets the frame for Shoshone County. In 2020, eviction data did not move in a normal way. Public health rules, court operations, and emergency aid all shaped the numbers. Any county level reading has to be viewed in that broader 2020 context.
Shoshone County housing profile
Shoshone County had 13,169 residents in the 2020 Census. The county had 5,763 households in the 2020 to 2024 ACS period, a median household income of $55,527, and a poverty rate of 15.4 percent. The county also had 23.9 percent of residents age 65 or older, which points to a sizable older population that often lives on fixed income.
Housing conditions in the county also matter. Census QuickFacts shows an owner occupied housing rate of 74.0 percent, median gross rent of $943, and a median value of owner occupied housing of $267,400. Those figures point to a county with a relatively small renter share, which means eviction rates can change faster when only a few renter households are affected.
The county also has 14,074 residents in the July 1, 2024 population estimate, which shows that Shoshone County remains a small rural county rather than a large metro area. Small counties often show more noticeable rate swings because the denominator is smaller. That is a data based inference from the county’s household and housing profile.
Shoshone County formal eviction rate in context
Secondary summaries of IPI’s county map report Shoshone County’s 2020 formal eviction rate at about 1.10 percent. Read alongside Idaho’s statewide 0.6 percent formal eviction rate, that suggests a higher local rate than the state average. The official IPI page confirms that county level data are available in the interactive map, even though the plain text page does not print the county value itself.
That result should be read carefully. A county rate does not only reflect how many families faced housing loss. It also reflects how many renting households live in the county. In a place like Shoshone County, where most occupied housing is owner occupied, a small number of court cases can create a larger percentage change than the same number would in a much larger county. That is an interpretation based on IPI’s rate formula and the county’s housing structure.
The rate also needs to be separated from raw counts. A county may have only a limited number of formal evictions, but if the renter base is small, the rate can still look high. This is one reason county comparisons work best when the rate and the local housing profile are reviewed together.
Why 2020 looked different from a normal year
The 2020 eviction trend should not be read as a normal market year. IPI said the low point in April 2020 came during statewide court closures, then filings rose after courts reopened in May. The institute also linked the year’s fluctuations to the federal eviction moratorium, unemployment benefits, and emergency rental assistance. Those policy actions changed when cases moved forward and how many households could avoid formal removal.
The Idaho Supreme Court’s 2020 eviction order also shows that eviction policy was active during the pandemic period. That means the 2020 data reflects both housing stress and legal restrictions. For Shoshone County, this matters because local results were affected by state and federal rules at the same time.
Formal eviction data also leaves out some housing loss. It does not count every forced move, every lease nonrenewal, or every renter who leaves before a court case ends. Because IPI’s measure is court based, it shows one part of housing instability, not every part. That is not a flaw in the data. It is the boundary of what the data is designed to measure.
You can also explore sustainable infrastructure solutions like Self Cleaning Streetlight Oil Palm Waste for better urban maintenance and eco-friendly public systems.
What the county data shows
Shoshone County’s 2020 eviction trend fits a rural housing pattern with a small renter pool, older residents, and modest but real income pressure. The county’s median rent of $943 and median household income of $55,527 provide useful context, but they do not erase the fact that many households still live close to the edge when income is uneven or seasonal.
The county’s 15.4 percent poverty rate also matters because eviction risk rises when household savings are thin and incomes are unstable. In that setting, even short term disruptions can move a household into court quickly. For that reason, the 2020 formal eviction rate should be viewed as one indicator of housing strain, not the full measure of it.
Shoshone County’s small population, rural housing stock, and high owner occupancy mean that local eviction trends can look different from Idaho’s larger counties. The county result is best understood as part of a broader housing picture that includes rent levels, income, poverty, age, and the legal conditions that shaped 2020 court activity.
The Idaho Policy Institute county map remains the main public source for county level eviction comparison across Idaho’s 44 counties. For Shoshone County, the 2020 figure should always be read beside the statewide 0.6 percent formal eviction rate and the county’s own housing profile.
Many organizations also improve operational efficiency through Call Center Outsourcing with Garage2Global, especially when managing high-volume public service or administrative support systems.